
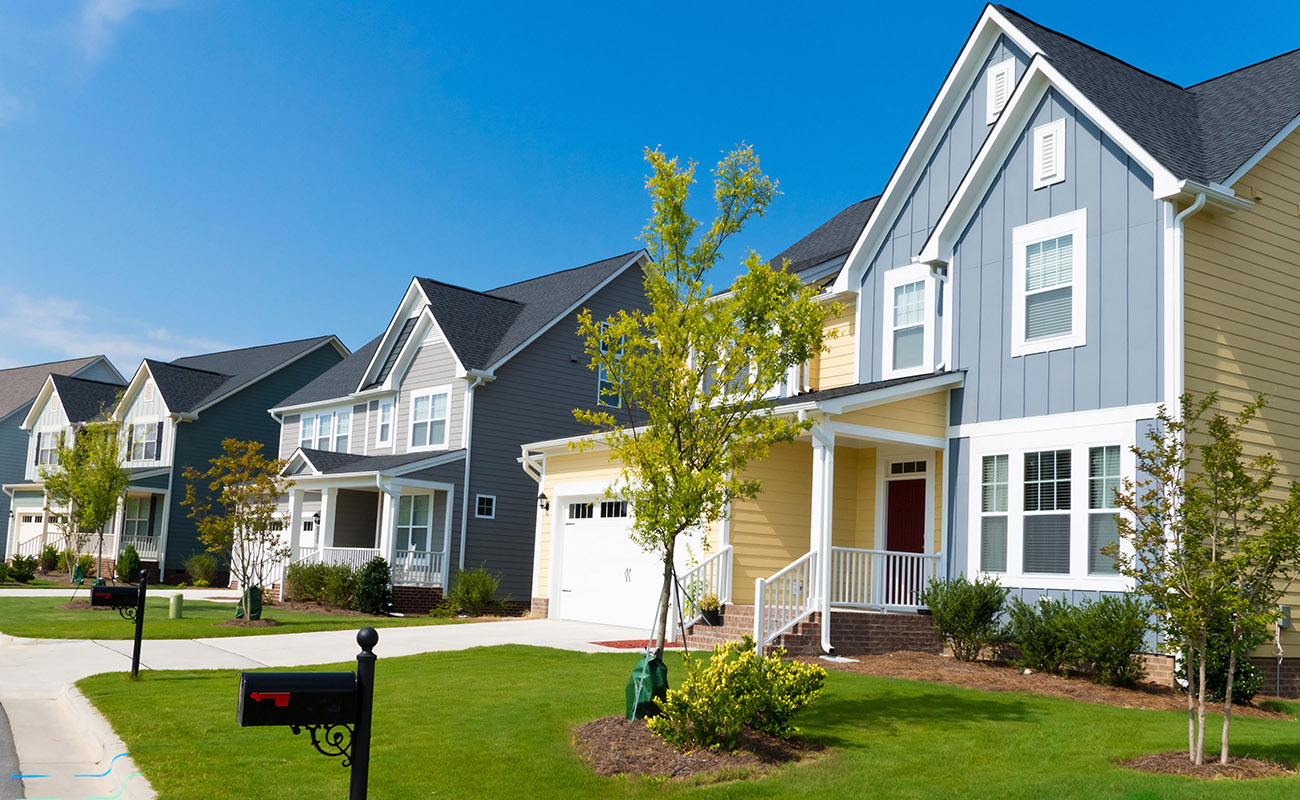
How Much House Can I Afford?

How do Debt to Income Ratios Work?
Lenders estimate the ability of a borrower to repay their loan based upon factors like how much debt they carry along with what their monthly debt service costs are. This calculator uses a 28% front-end ratio (housing expenses versus income) & a 36% back-end ratio (monthly debt payments versus income), though you can adjust them to the limits set by your lender. 28/36 are historical mortgage industry standers which are considered ideal by lenders & are still used in some automated loan underwriting software programs, though lenders approve borrowers with higher DTI ratios. Click here for more information about DTI limits for all major loan types.
Unsure of how much home you can afford? Use our free calculator to find out how big of a loan you can qualify for given your current monthly income & your monthly debt payments. Current Columbus home loan rates are shown beneath the calculator.
Mortgage Affordability Calculator
Columbus's Current Rates on a 30-Year Fixed-rate $364,677 Mortgage
The following table highlights current Columbus mortgage rates. By default 30-year purchase loans are displayed. Clicking on the refinance button switches loans to refinance. Other loan adjustment options including price, down payment, home location, credit score, term & ARM options are available for selection in the filters area at the top of the table.
Preparing Your Finances to Afford a Mortgage
The road to homeownership takes solid commitment and thorough financial planning. A house is easily one of the most expensive purchases people make, which is why we rely on loans to afford a home. To be eligible for a mortgage, borrowers must have a good credit score, build more income, and save adequate down payment.
But before you apply for a mortgage, it’s a good idea to realistically assess how much house you can afford. It’s crucial to establish a budget and check how much homes cost in your preferred area. You can also use the above calculator to give you an idea how much monthly mortgage payments you can afford.
To help you out, our article will provide an overview of how much homes might cost, as well as how lenders evaluate mortgage affordability through debt-to-income ratio. We’ll discuss how much down payment you should save and explain the benefits of making a 20% down on your home. Moreover, we’ll include different types of mortgages with affordable options. The guide will also discuss the required mortgage reserves and how much budget you should prepare for closing costs.
How Much Does the Average Home Cost?
According to the U.S. Census Bureau, $335,300 is the median sales for price of new houses sold as of November 2020. While the median is one way to gauge home prices, the cost of your house will depend of different factors. This includes the home’s location, size, and overall features of the property. Generally, the larger a house, the more it will cost.
Properties located in cities and bustling metro areas tend to have higher prices. The growing house supply shortage also contributes to the rising cost of property. As the 2020 recession approached, Freddie Mac reported that there was a housing shortage of 2.5 million units. Zillow economist Matthew Speakman noted that there were fewer than three months of available homes in the market, which is the lowest record since the turn of the century.
Historically, house prices in America have significantly increased since the ’60s. Based on data from the Federal Reserve, the median sales price of a house in Q1 of 1963 was $17,800. When adjusted for inflation, this would only cost around $150,550 in 2020. By Q1 of 1990, the median house price grew to $123,900, which costs around $245,345.70 when adjusted for inflation in 2020.
Come Q1 of 2020, the median home sales price has grown to a whopping $329,000. And if we compare this from Q1 of 2010, which is $222,900, it shows that the median home price has increased by $106,100 in the last 10 years. While home prices may fluctuate depending on the economic climate, the trend shows that home values steadily increase over the years.
U.S. Home Median Sales Prices (1963-2020)
| Year | Median Sales Price Q1 | Year | Median Sales Price Q1 |
|---|---|---|---|
| 1963 | $17,800 | 1992 | $119,500 |
| 1964 | $18,900 | 1993 | $125,000 |
| 1965 | $20,200 | 1994 | $130,000 |
| 1966 | $21,000 | 1995 | $130,000 |
| 1967 | $22,300 | 1996 | $137,000 |
| 1968 | $23,900 | 1997 | $145,000 |
| 1969 | $25,700 | 1998 | $152,200 |
| 1970 | $23,900 | 1999 | $157,400 |
| 1971 | $24,300 | 2000 | $165,300 |
| 1972 | $26,200 | 2001 | $169,800 |
| 1973 | $30,200 | 2002 | $188,700 |
| 1974 | $35,200 | 2003 | $186,000 |
| 1975 | $38,100 | 2004 | $212,700 |
| 1976 | $42,800 | 2005 | $232,500 |
| 1977 | $46,300 | 2006 | $246,300 |
| 1978 | $53,000 | 2007 | $257,400 |
| 1979 | $60,600 | 2008 | $233,900 |
| 1980 | $63,700 | 2009 | $208,400 |
| 1981 | $66,800 | 2010 | $222,900 |
| 1982 | $66,400 | 2011 | $226,900 |
| 1983 | $73,300 | 2012 | $238,400 |
| 1984 | $78,200 | 2013 | $258,400 |
| 1985 | $82,800 | 2014 | $275,200 |
| 1986 | $88,000 | 2015 | $289,200 |
| 1987 | $97,900 | 2016 | $299,800 |
| 1988 | $110,000 | 2017 | $313,100 |
| 1989 | $118,000 | 2018 | $331,800 |
| 1990 | $123,900 | 2019 | $313,000 |
| 1991 | $120,000 | 2020 | $329,000 |
If you plan to purchase a home within the next 5 years, be prepared to anticipate increasing home prices. In the meantime, you must save ample down payment to afford a home. Once you’re ready, you can shop around for different lenders and choose one that offers the best deal.
Prepare Your Down Payment
With hefty home prices on the market, prospective homebuyers find it challenging to gather enough down payment for a home. And if you’re looking to buy a house in a populous city, expect to pay a higher down payment amount.
How much down payment should you make? Lenders generally prefer borrowers who make a 20% down payment based on their home’s purchase price. If your house is valued at $350,000, a 20% down payment would be $70,000. With this large amount, you better start saving as soon you can. Making a large down payment is also a good sign to lenders. This suggests you can diligently save over time and pay back your debts.
Though 20% is the ideal down payment, this is often unaffordable for most homebuyers. Practically speaking, not everyone can gather that much money in a couple of years. More people elect to make smaller down payments to secure a home.
In 2020, the median down payment for all homebuyers was only 12%, according to the National Association of Realtors. It was 16% for repeat buyers and only 7% for first-time buyers. In contrast to 1989, the median down payment was 20%, with 23% for repeat buyers, and 10% for first-time buyers. The data shows that smaller down payments are a consequence of much higher property prices.
What is the Minimum Down Payment?
The required minimum down payment differs per lender and type of loan. This is also based on your credit rating and financial history. But in general, many conventional loan lenders accept a 5% down payment if you have a good credit record. Meanwhile, government-backed loans such as FHA mortgages allow borrowers to pay as low as 3.5% down if they meet specific credit qualifications. VA and USDA loans offer 100% financing, which means a down payment is not required.
The Advantages of Paying 20% Down
Despite financial challenges borrowers face, many financial experts still recommend saving for a 20% down payment. A higher down payment can help bolster your mortgage savings in the long run. It is also more appealing to lenders. Here are reasons why you should pay 20% down:
- Improve Your Chances of Loan Approval: Making a large down payment is a sign you are capable of saving money and paying back debt. Offering a larger amount also decreases risk for lenders. This makes you an attractive and creditworthy borrower.
- Secure a Lower Interest Rate: Offering a large down payment significantly reduces your loan-to-value ratio (LTV). LTV is a risk indicator used by lenders to measure your loan amount relative to the price of your property. Paying 20% will reduce your LTV ratio to 80%. With a low enough LTV ratio, you can obtain a lower interest rate.
- Avoid Private Mortgage Insurance (PMI): Paying 20% down eliminates the cost of PMI for conventional loans. PMI is an extra cost required by lenders if your down payment is below 20%. This protects lenders in case you fail to repay your mortgage. PMI can cost anywhere between 0.25% to 2% of your loan amount per year. It’s required for a limited time, which is cancelled once your LTV ratio reaches 78%. You can maximize your savings by avoiding this extra charge.
- Reduce Your Monthly Payment & Interest Costs: Making a large down payment immediately reduces your principal (the amount you borrowed). A smaller loan principal results in more affordable monthly payments and total interest charges. For example, a 30-year fixed-rate loan worth $320,000 at 3.2% APR has a monthly principal and interest payment of $1,383. It costs a total of $178,201.83 in interest charges. Meanwhile, a $300,000 30-year fixed-rate loan with the same rate has a monthly principal and interest payment of $1,297.40. It’s total interest cost is $167,064.21, which is lower by $11,137.62 than the first example. This shows a smaller principal significantly reduces your monthly payments and overall interest costs.
- Gain Home Equity Faster: Paying 20% down builds home equity sooner and helps pay for your mortgage faster. If you intend to make extra payments to prepay your mortgage, making a large down payment will give you a head start. But to avoid costly fees, don’t forget to ask about prepayment penalty first. Once you gain substantial home equity, you can tap this wealth through a HELOC in the future. Homeowners can use this money for major home improvements and other important expenses.
Estimating Mortgage Affordability with DTI Ratio
Besides knowing how much you should save, you must know how much home you can afford. Apart from your credit score and financial history, lenders evaluate your income together with your debts. To verify if you have enough income to make monthly payments, lenders assess your debt-to-income ratio (DTI). DTI ratio is a key factor for measuring creditworthiness or your ability to pay back debt. This is vital for determining if you can afford to obtain a mortgage. It also estimates how much you are able to borrow from a lender.
DTI ratio is a measurement that compares your total monthly debts with your gross monthly income. Expressed as a percentage, it indicates how much of your earnings go toward paying debts. The idea is to earn more money than you spend. A high DTI ratio indicates your finances are saddled with too many debts. This reduces your chances of loan approval. If you do get approved, the lender will likely give you a higher rate. So make sure to reduce your debts before applying for a mortgage.
In contrast, a low DTI ratio means have enough money to make timely payments. You also have room in your budget in case emergency expenses come up. A lower DTI ratio poses less risk for lenders, improving your chances of loan approval. Borrowers with low DTI ratios are given favorable rates, which lower the overall interest cost of a loan.
Though DTI ratio compares your income and debts, it is not a full measurement of mortgage affordability. DTI ratio does not factor other significant daily expenses such as utilities, food, transportation, and other discretionary costs. With this in mind, it’s best to keep a lower DTI ratio than the limits imposed by your lender.
Updating Loan Qualifications
While assessing DTI ratio is a useful indicator for mortgage affordability, in June 2020, the Consumer Financial Protection Bureau proposed to change mortgage qualifications away from DTI. The bureau recommended replacing the DTI limit with a price-based approach, as quoted below:

“[T]he Bureau proposes to amend the General QM definition in Regulation Z to replace the DTI limit with a price-based approach. The Bureau is proposing a price-based approach because it preliminarily concludes that a loan’s price, as measured by comparing a loan’s annual percentage rate to the average prime offer rate for a comparable transaction, is a strong indicator and more holistic and flexible measure of a consumer’s ability to repay than DTI alone.
For eligibility for QM status under the General QM definition, the Bureau is proposing a price threshold for most loans as well as higher price thresholds for smaller loans, which is particularly important for manufactured housing and for minority consumers. The NPRM also proposes that lenders take into account a consumer’s income, debt, and DTI ratio or residual income and verify the consumer’s income and debts.”
Couples also typically apply together for a mortgage. When you apply with your spouse, your DTI ratio will be evaluated with your spouse’s after-tax income and debts. If your spouse has a good credit history, this will improve your chances of loan approval. But if they have a poor credit record, this might pull down your evaluation. In this case, it might be best to apply individually.
Lenders evaluate two types of DTI ratios: front-end DTI and back-end DTI.
Two Main DTI Ratios
Front-end DTI ratio: Measures all your home-related expenses relative to your gross monthly income. It includes your monthly mortgage payments, property taxes, homeowner’s insurance, HOA fees, etc. Conventional lenders typically prefer a front-end DTI ratio that does not exceed 28%.
Back-end DTI ratio: This includes your front-end DTI expenses (housing-related costs) together with all your other debts. It includes payments for car loans, student loans, credit cards, etc. Conventional lenders ideally prefer a back-end DTI ratio of 36%. But depending on your financial background, they may accept 43%. Compensating factors such as student loans may allow up to 50%.
The required DTI limits vary depending on the type of loan you take. The following table details specific DTI limits for conventional loans as well as government-backed mortgages such as FHA loans, VA loans, and USDA loans.
Debt-to-income Mortgage Loan Limits
| Loan Type | Front-end | Back-end | Hard Limit | Notes |
|---|---|---|---|---|
| Recommended | 28% | 36% | n/a | Ideal borrower, receives low APR. Higher DTI gets you a higher rate. |
| Conventional | 28% | 36% to 43% | 45% to 50% | Each lender approves based on a variety of factors such as credit score, income & assets, credit history, etc. |
| FHA | 31% | 43% | 57% | If you have high DTI, you need compensating factors. Ex. If your DTI is over 43%, the lender might impose a higher down payment. |
| VA | most lenders refer to the back-end DTI ratio | 41% | ~ 47% | Each lender decides based on a variety of factors for each veteran. Lenders must explain why they approve any loan above a 41% limit. Basic housing & sustenance allowance count toward qualifying. |
| USDA | 29% – 32% | 41% | 41% | Loans that cater to borrowers in rural markets with incomes below 115% of the local median income. See more details here. |
Generally, the back-end ratio is typically more important than the front-end ratio. The soft limits may allow approval using automated underwriting software. On the other hand, the hard limits may require manual underwriting approval, which makes the process longer. It will also require other compensating factors such as a high credit score, larger down payment or perhaps, even a co-signer.
Calculating How Much House You Can Afford

To determine your qualifying loan amount, we’ll use the above calculator for the following example. When using the above calculator, if you need a format without a front-end limit, you can set the front-end box to 100 (for 100%). This way, the calculator bases your loan limit on the back-end limit that you entered.
Let’s presume you’re applying for a mortgage with your spouse. Your gross annual income is $70,000, while your partner’s annual after-tax income is $60,000. This is a combined annual income of $130,000, while your total monthly debts amount to $1,650. Together, you we’re able to save a down payment worth $65,000. If you plan to obtain a 30-year fixed-rate mortgage at 3.5% APR, how much is your estimated qualifying loan amount and monthly mortgage payments? See the results below.
30-year Fixed-Rate Loan
Your Gross Annual Income: $70,000
Spouse’s Annual After-Tax Income: $60,000
Combined Annual Income: $130,000
Front-end DTI Limit: 28%
Back-end DTI Limit: 36%
Down Payment: $65,000
Annual Interest Rate: 3.5%
PMI: 0.5%
Annual Property Taxes: $3,500
Annual Homeowner’s Insurance: $1,200
Monthly HOA fees: $300
Vehicle Payments: $500
Credit Card Payments: $300
Student Loan Payments: $450
Other Monthly Debt Payments: $400
Combined Monthly Debts: $1,650
| Loan Details | Amount |
|---|---|
| Maximum Qualifying Loan Amount | $347,033.02 |
| Home Price | $412,033 |
| Down Payment | $65,000, 15.78% of the home’s price |
| Maximum Monthly PMI Payment | $144.60 |
| Monthly Mortgage Payment | $1,558.33 |
| Front-end Max. Monthly Payment w/ PMI | $2,197.07 |
| Back-end Max. Monthly Payment w/ PMI | $1,413.74 |
| Front-end Max. Total Mortgage Payments | $489,276.38 |
| Back-end Max. Total Mortgage Payments | $314,831.97 |
*This just an estimate. Your actual qualifying loan amount will depend on your financial profile and your lender.
According to the results, your maximum qualifying loan amount would be $347,033.02, which is based on a home price of $412,033. Your down payment is 15.78% of the home’s value, which means your mortgage will include PMI. In this example, since PMI is 0.5% of your loan, your monthly PMI payment will be $144.60. As a result, your maximum monthly mortgage payment will be $1,558.33.
If we based your monthly mortgage payment on front-end DTI, your maximum monthly payment will be $2,197.07. And if your monthly mortgage payment is based on back-end DTI, your maximum monthly payment will be $1,413.74.
Using the above calculator, we were able to determine a feasible home price you can afford, which is $412,033. It also shows your current down payment is only 15.78% of the home’s price. To make 20% down on a $412,000 home, you should save a $82,406.60, which is $17,406.60 higher than your current down payment.
If you find this too expensive, you can opt for a more affordable home. With a $325,000 house, your current down payment ($65,000) is 20% of the home’s price. This eliminates PMI and fits well within your budget. If you’re willing to look for a lower-priced property, consider this option to save on your mortgage payments.
Mortgages with Low Down Payment Options

The rising property prices make it difficult for buyers to afford a home. In reality, not everyone has enough income or time to save up for a large down payment. And if you have a low credit score below 680, you may have trouble qualifying for a traditional conventional loan. Under these situations, it’s worth turning to the following government mortgage programs. These loans typically come with lenient credit requirements and low down payments.
FHA Loans
The Federal Housing Administration sponsors FHA loans. This financing option is geared towards low to moderate income families, especially first-time homebuyers. It caters to borrowers looking for affordable mortgage options with more forgiving credit standards. For borrowers with credit scores between 500 to 579, you can obtain an FHA loan as long as you make a 10% down payment. If you have a credit score of 580, you’re allowed to make a down payment as low as 3.5% of the home’s price.
Borrowers can secure FHA loans from banks, credit unions, and mortgage companies. Though it comes with relaxed credit requirements, it’s still worth improving your credit score to obtain a good rate from your lender. If you can only afford a small down payment, you should work on raising your credit score to at least 580.
Mortgage Insurance Premium

When you take an FHA loan, you’re required to pay mortgage insurance premium (MIP). This insurance safeguards your lender in the event you default on your payments. It’s also the trade-off you make for the low down payment option. MIP comes in two payments: the upfront MIP fee and the annual MIP fee. The upfront MIP is 1.75% of your loan amount, while the annual MIP can range from 0.45% to 1.05% of your loan amount.
MIP is charged for the entire duration of a 30-year fixed-rate FHA loan. Meanwhile, 15-year FHA loans impose MIP for 11 years. To remove MIP, borrowers consider refinancing into a conventional mortgage. MIP is an extra cost that can forfeit savings from affordable payments. Take note of this added cost before taking an FHA loan.
VA Loans
Mortgages backed by the U.S. Department of Veterans Affairs are called VA loans. These are special financing options exclusively given to active military members, veterans, and eligible military spouses. The government designed VA loans to aid returning military who need affordable housing. Since going on duty for years can make it difficult to build credit, the VA program makes it easier for military members to obtain low-cost home financing with flexible credit requirements.
VA loans come with a zero-down option, which means you are not required to make a down payment. As an incentive, VA loans also have lower interest rates than its conventional counterpart. While they have lenient credit standards, most VA-sponsored lenders would rather accept borrowers with a credit score of at least 620.
VA Funding Fee
Though VA loans do not impose MIP, they charge a mandatory VA funding fee to lower the cost of the loan for American taxpayers. It’s the compromise borrowers take for the zero-down option. The VA funding fee can be paid as a one-time payment during closing, or can be rolled into your monthly payments.
The VA funding fee varies per borrower. It depends on the size of your loan amount, your down payment, VA funding fee rate, and how many times you’ve used your VA benefit. The VA finding fee rate costs between 1.4% to 3.6% of your loan. Expect a higher rate when you’ve previously used your VA benefit. Borrowers can help reduce their VA funding fee by opting to make a down payment.
USDA Loans
Homebuyers thinking of living away from the city can take advantage of USDA loans. These mortgages are backed by the U.S. Department of Agriculture, which specifically targets low to moderate income families. As a condition, financing is only eligible in USDA rural areas. Similar to VA loans, USDA mortgages offer a zero-down payment option. It also comes with relaxed credit requirements and lower interest rates compared to traditional conventional loans.
To qualify for a USDA loan, you must have a credit score of at least 640. Borrowers may still be accepted with credit scores between 600 to 639, but this requires manual underwriting procedures. Your loan will also take much longer to evaluate and approve. USDA loan applicants must satisfy income limits. As a rule, your household income (including the annual income of all working adults in your home) must be no greater than 115% of the median household income in your area.
USDA Guarantee Fee
Like FHA loans, USDA loans also require mortgage insurance premiums called the USDA guarantee fee. This extra cost is paid as an upfront fee and an annual fee. The upfront guarantee fee costs 1% of your loan amount, while the annual guarantee fee costs 0.35% of your loan balance. As your loan amount is reduced, so does your annual guarantee fee. These rates are also lower compared to MIP rates on FHA loans. The USDA guarantee fee is typically required for the entire duration of the mortgage.
Conventional Loans with Affordable Down Payment
Besides government-backed loans, there are conventional mortgage programs that provide affordable down payment options.
HomeReady Mortgage Program
The HomeReady Program is backed by Fannie Mae to provide affordable home financing for borrowers with limited income and low credit scores. They specifically focus on borrowers from disaster-prone communities in the country. With the HomeReady program, you can make a down payment as low as 3%. It also comes with reduced mortgage insurance that is canceled once your LTV reaches 80%.
To be eligible for the HomeReady program, your credit score must be at least 620. A borrower’s income should also be less than 100% of their area’s median income, though there are some exceptions depending on the home’s location. The program also allows borrowers to use cash gifts from family and friends as down payment.
Conventional 97 Loan
Conventional 97 loans are offered by Fannie Mae and Freddie Mac. It also allows you to make a 3% down payment, which finances up to 97% of your mortgage. To qualify for this type of loan, you must have a credit score of 620 and above. For borrowers applying with their wife/husband or co-borrower, at least one should be a first-time homebuyer. A first-time homebuyer is an individual who has not owned residential property within three years of taking a Conventional 97 loan. Borrowers are allowed to make down payments based entirely on gift money. Mortgage insurance is also required, but it’s removed once your LTV reaches 80%.
Get Ready with Mortgage Reserves

Besides having ample income and down payment, lenders may require a specific amount of cash before granting your mortgage. These are called mortgage or cash reserves, which act as emergency funds in case you face financial hardships. It guarantees your mortgage payments in case you fall ill, face sudden unemployment, or huge losses on your business. Having enough cash reserves allow you to continue making monthly payments while you’re searching for a stable source of income.
Cash reserves are based on your total monthly mortgage payment, which is measured in months. Most lenders ask for at least two months’ worth of mortgage payments, which include your property tax and insurance costs. However, depending on your lender, some may require up to six months, or even twelve months’ worth of liquid reserves.
For example, let’s presume your monthly mortgage payment including real estate taxes and insurance is $2,100. If your lender is asking for three months of cash reserves, you must present $6,300 in your bank account. Failure to do so means your lender can reject your loan application.
Cash in savings or checking accounts are accepted mortgage reserves. You can also present the following assets:
- Certificates of deposit (CD)
- Stocks or bond investments
- Life insurance policies
- Trust accounts
- Money market funds
- Mutual funds
- 401(k)s, IRAs, other retirement accounts
The amount of required cash reserves varies per type of mortgage. Refer to the chart below:
| Mortgage Type | Required Cash Reserves |
|---|---|
| Conventional Loans | 2 months to 6 months Depends on the strength of your financial profile |
| FHA Loans | Needed for 3 – 4 unit housing Should cover at least 3 months |
| VA Loans | Cash reserves are not mandatory But can be used as a compensating factor |
| USDA Loans | Cash reserves are not required for primary single-unit housing *Exception: If you’re using rental money to apply for 3 – 4 unit housing you’ll need 3 – 6 months of cash reserves |
Budget for Closing Costs
Closing costs are a combination of different fees borrowers pay to complete a mortgage deal. These are upfront costs which include origination fees, property appraisal fees, home inspections costs, title insurance, etc. Besides your down payment, don’t forget to budget extra funds for closing expenses. You can negotiate closing fees with your lender to help reduce your mortgage expenses.
How much are closing costs? This ranges between 3% to 6% of your loan’s value. For instance, if you took a $280,000 loan, your closing cost will be around $8,400 to $16,800. And though you can finance your closing costs, the best way to cover it is to pay for it upfront. Financing closing costs will increase your loan amount, which raises your monthly payment and overall interest charges.
In 2019, ClosingCorp gathered the most comprehensive data for national average closing costs per state. According to their findings, in 2019, the average closing cost for a single-family housing was $5,749 with taxes and $3,339 without taxes. The top three states with the most expensive average closing costs were District of Columbia, Delaware, and New York. These are states with highly populated cities. Meanwhile, the top three states with the most affordable average closing costs were Indiana, Missouri, and South Dakota.
For the full list of average closing costs per state, refer to chart below:
| State | Ave. home sale price | Ave. closing cost w/ taxes | Ave. closing cost w/o taxes | % of home sale price |
|---|---|---|---|---|
| District of Columbia | $645,108 | $25,800 | $5,723 | 4.00% |
| Delaware | $281,308 | $13,273 | $3,350 | 4.72% |
| New York | $421,836 | $12,847 | $5,612 | 3.05% |
| Washington | $433,404 | $12,406 | $4,538 | 2.86% |
| Maryland | $325,234 | $11,876 | $3,737 | 3.65% |
| Pennsylvania | $206,405 | $10,076 | $4,059 | 4.88% |
| Connecticut | $321,609 | $7,091 | $3,489 | 2.20% |
| Hawaii | $646,019 | $6,746 | $5,388 | 1.04% |
| California | $622,881 | $6,537 | $5,064 | 1.05% |
| Florida | $280,389 | $6,457 | $3,569 | 2.30% |
| New Hampshire | $274,653 | $6,271 | $2,485 | 2.28% |
| New Jersey | $359,349 | $6,012 | $3,635 | 1.67% |
| Vermont | $231,934 | $5,994 | $2,934 | 2.58% |
| Massachusetts | $497,429 | $5,964 | $3,876 | 1.20% |
| Virginia | $330,371 | $5,959 | $3,282 | 1.80% |
| Illinois | $238,982 | $5,609 | $4,502 | 2.35% |
| Nevada | $331,296 | $5,546 | $3,851 | 1.67% |
| Rhode Island | $318,095 | $4,527 | $2,912 | 1.42% |
| Utah | $363,324 | $4,026 | $4,026 | 1.11% |
| Michigan | $172,599 | $4,014 | $2,716 | 2.33% |
| Oregon | $356,408 | $3,969 | $3,612 | 1.11% |
| Minnesota | $248,296 | $3,785 | $2,434 | 1.52% |
| Tennessee | $213,455 | $3,745 | $2,575 | 1.75% |
| Texas | $274,163 | $3,744 | $3,744 | 1.37% |
| Colorado | $424,479 | $3,672 | $3,593 | 0.86% |
| Georgia | $231,593 | $3,658 | $2,792 | 1.58% |
| Maine | $259,925 | $3,654 | $2,543 | 1.41% |
| Arizona | $296,978 | $3,631 | $3,631 | 1.22% |
| Alaska | $300,079 | $3,517 | $3,517 | 1.17% |
| West Virginia | $158,063 | $3,384 | $2,483 | 2.14% |
| Louisiana | $193,364 | $3,365 | $3,040 | 1.74% |
| Ohio | $165,732 | $3,360 | $2,846 | 2.03% |
| South Carolina | $228,866 | $3,316 | $2,402 | 1.45% |
| Idaho | $290,099 | $3,063 | $3,063 | 1.06% |
| Oklahoma | $152,272 | $2,997 | $2,631 | 1.97% |
| New Mexico | $258,857 | $2,908 | $2,908 | 1.12% |
| North Carolina | $237,867 | $2,839 | $2,308 | 1.19% |
| Montana | $292,942 | $2,773 | $2,773 | 0.95% |
| Wisconsin | $195,654 | $2,615 | $2,158 | 1.34% |
| Arkansas | $160,261 | $2,562 | $2,056 | 1.60% |
| Mississippi | $224,323 | $2,548 | $2,548 | 1.14% |
| Kansas | $236,909 | $2,459 | $2,459 | 1.04% |
| Wyoming | $283,881 | $2,430 | $2,430 | 0.86% |
| North Dakota | $214,782 | $2,428 | $2,428 | 1.13% |
| Alabama | $174,247 | $2,416 | $2,198 | 1.39% |
| Nebraska | $189,620 | $2,303 | $1,952 | 1.21% |
| Kentucky | $172,637 | $2,276 | $2,126 | 1.32% |
| Iowa | $172,227 | $2,194 | $1,954 | 1.27% |
| South Dakota | $181,137 | $2,159 | $2,002 | 1.19% |
| Missouri | $202,572 | $2,063 | $2,063 | 1.02% |
| Indiana | $193,284 | $1,909 | $1,909 | 0.99% |
When It’s More Practical to Rent

Since buying a home entails huge expenses, some people opt to rent, at least for the meantime. While the primary advantage of renting is flexibility, it should ideally help people save. This is crucial especially if you’re preparing for major life changes, such as buying a house, getting married, or welcoming a new baby into your family. Young people looking for stable jobs benefit from renting while they build their careers. Presuming your monthly rent is cheaper than a mortgage, renting gives you time to build savings and increase your income.
In 2019, iProperty Management reported that 44 million U.S. households rented their home. While most people think renters are young, the survey found that 33% of renters were actually between the age of 30 to 44. Meanwhile, 30% of renters were 45 to 64 years old, and only 22% were below the age of 30. The data shows that a significant percentage of renters are over the age of 30 or middle aged. This may indicate that rising home prices have pushed people to rent longer before they can buy a house.
Generally, the cost of monthly rent is more affordable than mortgage payments, at least in the short term. But the longer you rent, the more you spend on property that you won’t own. That’s money you spent that could have gone to a mortgage. And considering inflation, you must prepare yourself for increasing rental prices in the coming years. Thus, it’s ideal to eventually buy a house especially if you intend to settle down.
Rent is more affordable in places where there is low demand for rental spaces. Likewise, rent increases in areas where more people are looking to rent. When this occurs, landlords increase rent to keep costs competitive, even close to national mortgage prices. Rent is typically higher in densely populated metro areas and locations where there are more job opportunities for people.

COVID-19’s Impact on Renting
In a 2020 year-end report by Rent Café, renting activity was slower by 10% than the previous year. The rental season also experienced a two-month delay, which usually began in March and lasted till August. Because of stay-at home orders and lockdowns caused by the COVID-19 crisis, the rental season began in May. This ushered a 27% increase in rental activity. However, the moving season was cut short to two months, with renter movement declining to 13% as soon as July 2020.
Furthermore, compared to the previous year, 2020 saw more renters leaving 18 out of 30 of the largest cities in the U.S. The report notes that due to the COVID-19 pandemic, a significant number of people were leaving large and dense cities for less populated areas. Rent prices have also dropped, as the average national rent stagnated at $1,465 as of November 2020. In contrast to 2019, the national average rent was at $1,474.
The sharpest rent declines occurred in the country’s most expensive cities. In San Francisco, rent decreased to $3,055 in 2020 from $3,695 in 2019. This recorded a 17.3% year-over-year drop. In second place came Manhattan which declined to $3,761 in 2020 from $4,215 in 2019, showing a 10.8% year-over-year decrease. In third place came Seattle, with the average rent price declining to $1,966 in 2020 from $2,148 in 2019. This saw an 8.5% year-over-year decrease.
The following chart shows changes in rent prices from 2019 to 2020 for 30 of the largest U.S. cities.
Rent Prices in 30 of the Largest U.S. Cities, 2019-2020
| City | 2020 Ave. Rent | 2019 Ave. Rent | Change Y-o-Y |
|---|---|---|---|
| San Francisco, CA | $3,055 | $3,695 | -17.30% |
| Manhattan, NY | $3,761 | $4,215 | -10.80% |
| Seattle, WA | $1,966 | $2,148 | -8.50% |
| Boston, MA | $3,144 | $3,429 | -8.30% |
| Chicago, IL | $1,794 | $1,955 | -8.20% |
| San Jose, CA | $2,531 | $2,742 | -7.70% |
| Washington, D.C. | $2,083 | $2,234 | -6.80% |
| Los Angeles, CA | $2,359 | $2,503 | -5.80% |
| Austin, TX | $1,372 | $1,442 | -4.90% |
| Portland, OR | $1,493 | $1,542 | -3.20% |
| Nashville, TN | $1,399 | $1,431 | -2.20% |
| Denver, CO | $1,636 | $1,672 | -2.20% |
| San Diego, CA | $2,201 | $2,237 | -1.60% |
| Houston, TX | $1,108 | $1,116 | -0.70% |
| Philadelphia, PA | $1,643 | $1,653 | -0.50% |
| Dallas, TX | $1,247 | $1,243 | 0.30% |
| San Antonio, TX | $1,058 | $1,050 | 0.80% |
| Louisville, KY | $994 | $978 | 1.60% |
| Charlotte, NC | $1,286 | $1,256 | 2.40% |
| Oklahoma City, OK | $805 | $784 | 2.70% |
| Columbus, OH | $979 | $952 | 2.80% |
| El Paso, TX | $812 | $789 | 2.90% |
| Baltimore, MD | $1,312 | $1,274 | 3.00% |
| Detroit, MI | $1,102 | $1,068 | 3.20% |
| Fort Worth, TX | $1,171 | $1,132 | 3.40% |
| Las Vegas, NV | $1,150 | $1,110 | 3.60% |
| Indianapolis, IN | $933 | $894 | 4.40% |
| Jacksonville, FL | $1,162 | $1,111 | 4.60% |
| Memphis, TN | $863 | $819 | 5.40% |
| Phoenix, AZ | $1,182 | $1,120 | 5.50% |
Renting Has Fewer Property Costs
When you’re a renter, you normally don’t have to worry about regular maintenance and other expenses. These are mostly taken care of by your landlord. Unless there’s property damage that you directly caused, you don’t have to shoulder any expenses.
Meanwhile, homeownership requires you to commit to the following expenses:
- Home inspection and appraisal (before buying a house)
- Real estate taxes
- Homeowner’s association dues
- Routine maintenance and repairs
- Utility costs
On the downside, when you’re renting, you must agree to your landlord’s house rules. Things like smoking or bringing pets into your home may be a problem. You don’t have as much freedom or privacy to do as you please. While you may paint walls or alter certain fixtures, you’ll need your landlord’s permission to do certain updates.
Since you don’t own the property, it does not make sense to spend too much on renovations. At the end of the day, your landlord will ultimately benefit from the improvements you made. And if the landlord decides to sell the property, you have no choice but to look for a new place to rent.
Meanwhile, if you bought your own house, you have the liberty to customize and remodel your home as you please. Making improvements will also increase your property’s value, which is beneficial especially if you plan to sell your home in the future.
The following chart highlights the benefits and drawbacks of renting:
| Pros | Cons |
|---|---|
| Offers freedom and flexibility to move. | You’re forced to move if the landlord sells the property. |
| Usually more affordable than mortgage payments. You only spend on the deposit, monthly rent, and cost of moving. | Prepare for increasing rental prices. |
| Affordability gives you time to save and build income. | You must adhere to your landlord’s house rules. Ex. No smoking, no pets allowed, etc. |
| The landlord pays for maintenance and repairs. | You cannot fully customize the space because you don’t own it. |
| You don’t pay property taxes, homeowner’s association fees, and utilities. | There are no tax benefits from rent compared to taking a mortgage. You also don’t build home equity. |
In Summary

It’s important to determine how much home you can afford to prepare your finances. Lenders determine your qualifying loan amount based on your gross annual income, debts, and down payment. Using the above calculator, you can obtain a ballpark estimate of your qualifying loan amount and maximum monthly mortgage payment. Just note that this is not an official calculation. The actual loan amount will depend on your lender and the strength of your credit profile.
Lenders prefer borrowers who offer a 20% down payment on their home. This reduces credit risk for lenders, making you a more creditworthy borrower. A high down payment also significantly decreases your loan amount, which results in lower monthly payments. Moreover, paying 20% down removes private mortgage insurance (PMI) on conventional loans. This is an added cost meant to protect the lender in case you default on your loan.
While 20% is the ideal down payment, many borrowers cannot afford this hefty sum. You may also have a low credit score and limited income. If this is the case, you can try government-backed loans. An FHA loan lets you make 3.5% down payment if your credit score is 580. Other government-backed mortgages such as VA loans and USDA loans offer a zero-down payment option if you qualify for the loan.
Apart from saving down payment, you should also prepare mortgage reserves and closing costs. Mortgage reserves are equivalent to a month’s mortgage payments. Lenders usually require 2 to 6 months’ worth of reserves before they approve your loan. Closing costs, on the other hand, range between 3% to 6% of your loan amount. Be sure to factor these costs into your budget.
Finally, you must assess your long-term plans. If you’re moving in the next 7 years, it makes sense to rent for the meantime. But if you plan to have a family and settle down soon, it’s important to look for a good place to live in. Use your time to save money and build income to get ready for homeownership. Times are tough, but with enough preparation, it’s possible to buy your own home.
Columbus Borrowers: Are You Unsure Which Loans You'll Qualify For?
We have partnered with Mortgage Research Center to help Columbus homebuyers and refinancers find out what loan programs they are qualified for and connect them with Columbus lenders offering competitive interest rates.